I interviewed Matthew from another Story of the Seed team.
What have you learned from this project?
Matt learned planting is a fun experiment.
What surprised or amazed you?
Matt was surprised by the how the plant actually grew.
What made you laugh during this semester's work on the project?
Matt laughed about how it took him forever to make the blog posts.
What made you pause and think deeper?
Matt paused and thought deeper during blog post number four.
What was your favorite part of the project?
Matt liked watching the plants grow.
What was your least favorite part of the project?
Matt HATED making the blog posts.
Wednesday, December 10, 2014
Blog Post #8 "Jenny's Seed Story" - Sayra
I interviewed Jenny to ask about her experience with The Story of the Seed Project.
-What have you learned?
She learned that it takes a lot of maintenance to make sure the plant does not die.
-What surprised you or amazed you?
How quickly the plants revived after they were almost dead.
-What made you laugh?
“Our teammates were funny.”
-What made you pause and think a little deeper?
“How the experiments would be set up, like I didn’t know how to work that out in the beginning of the year.”
My Questions:
-Did you like doing the project? Why or why not?
She liked and didn’t like it because it was fun to do it but the time that was given for everything was too short.
-How was it like working in the garden?
On the days it did not rain, she said it was fun. She liked how she got to see how the plant changed throughout the weeks.
Blog Post #8 "Sayra's Seed Story- Jenny
I am interviewing Sayra, one of my teammates, about her experience with the Story of the Seed Project.
What have you learned from this project?
I learned how to take care of plants and how difficult it is to take care of a garden.
What surprised or amazed you?
I think what surprised me was how small our plant actually was. I expected it to be bigger.
What made you laugh during this semester's work on the project?
When we went to go check on our plants in the garden, the other teams would throw things at each other and just do stupid things. I don't know why but the other teams made me laugh.
What made you pause and think deeper?
When we put the plants back in the garden after they had died, they miraculously survived. This made me think about how that happens. How did the plant "come back to life" after it had died?
What was your favorite part of the project?
My favorite part was checking in on the plants in the garden. I liked seeing how much the plant had grown and changed.
What was your least favorite part of the project?
Having to write on the blog was the hardest. It was hard to find time to complete all of the blogposts.
Thursday, December 4, 2014
Blog Post #7 - Jacob
Me and the team/ squad are experimenting with a plant call Brassica Oleracea. "Brassica oleracea is the species of plant that includes many common foods as cultivars, including cabbage, broccoli, cauliflower, kale, brussels sprouts, collard greens, savoy, kohlrabi and Chinese kale. Forming a stout rosette of large leaves in the first year, the leaves being fleshier and thicker than those of other species of Brassica, adaptations to store water and nutrients in its difficult growing environment. In its second year, the stored nutrients are used to produce a flower spike 1 to 2 meters (3–7 ft) tall bearing numerous yellow flowers. Canary Islands where the frost is minimal and plants are thus freed from seasonality." I could predict it's chance of different offspring if I know their parents gene or traits. Kinda, because are plant isn't a flower.

How will your plant pass its genetic information on to the next generation? ^ Answer

The big quote was for Wiki.
Student Blog Post #7 - Sayra
We are experimenting with Brassica Oleracea. It has waxy,round leaves and is grown in north temperate regions. The plants need a cool growing season and lots of moisture if you want them to grow. It originated from western and southern Europe. Some of the plants in these species are cauliflower, broccoli, kale, cabbage, and kohlrabi.
If we want to predict what traits our plants have, we have to know what traits they have. For example, if our plant has heterozygous yellow stem genes it would have Pp (example letters.) If its pollen mixes with a homozygous recessive green stem plant, it would have pp genes. When they make offspring, it will have different options for traits. A punnet square will help you predict the traits that the offspring will have.
The plants will have an offspring that can be 50% heterozygous yellow stems, and another 50% chance of having homozygous recessive green stems. It is a mixture of both the parents genes which means that it is possible but very unlikely that it will look like one of its parent plants.
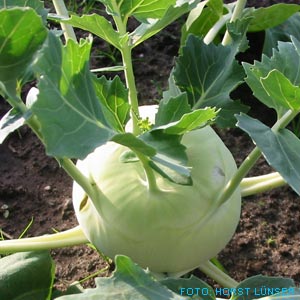
This is a picture of kohlrabi. The way it looks has been changed over the years. It has changed by generations of itself growing. This is like how offspring don't always look like their parents. Kohlrabi does not look exactly like the way it did before.
(The pictures are the same ones that Jenny and Jacob posted)
Here are some pictures of how our our plant looks right now. You can see that they are starting to die since other plants are kind of taking over it.If we want to predict what traits our plants have, we have to know what traits they have. For example, if our plant has heterozygous yellow stem genes it would have Pp (example letters.) If its pollen mixes with a homozygous recessive green stem plant, it would have pp genes. When they make offspring, it will have different options for traits. A punnet square will help you predict the traits that the offspring will have.
The plants will have an offspring that can be 50% heterozygous yellow stems, and another 50% chance of having homozygous recessive green stems. It is a mixture of both the parents genes which means that it is possible but very unlikely that it will look like one of its parent plants.
This is a picture of kohlrabi. The way it looks has been changed over the years. It has changed by generations of itself growing. This is like how offspring don't always look like their parents. Kohlrabi does not look exactly like the way it did before.
Blog Post #7- Jenny
The plant that we are experimenting with is called Brassica Oleracea. This plant stout herbaceous annual, biennial, to occasionally perennial. Generally, this plant has waxy, rounded leaves, and is usually grown in north temperate regions. This is because the plants need a cool growing season and lots of moisture to grow. This species originated from western and southern Europe. Some of these plants in these species are cabbage, broccoli, kale, cauliflower, and kohlrabi.

These are some of the recent picture our plants. They are starting to wither and die because they are being overrun with weeds and other plants. We hope that they will survive though.
To predict the kind of traits that our plants will have, we have to know what traits our own plant has. When A bee pollinates a plant, some of the pollen rubber off of the plant and onto the bee. Then the plant pollinates another plant and the pollen from the bee falls off and into the other plant. Suppose our plant has heterozygous purple stem genes. That would mean that it would have Ss ( I used random letters these are not actual results of an experiment. My data could be flawed). If the pollen from the first plant mixes with a homozygous recessive green stem plant, then it would have ss genes. When these two plants make offspring, the new plant would have different chances for traits. When you use a Punnet Square, you can predict what traits the offspring will have.
You can predict that the offspring will have a 50% chance to have heterozygous purple stems, and a 50% chance that the offspring will have homozygous recessive green stems. There are only small chances that the offspring will look exactly like only one of the parent plants. This is because the offering is a mixture of both the parent's genes.
(The blog won't let me upload a picture of wild Kohlrabi). Kohlrabi, before it was used for food, looks different from the version the we eat today, because it has been changed by generations. The new Kohlrabi has been changed by generations of itself growing. Like I said before, offspring doesn't always look like their parents. This means that the new Kohlrabi would not look like the old Kohlrabi.
Monday, December 1, 2014
Meiosis Demonstration- Jenny
*the blog would not allow me to make a video, so I had to make it like this.

This is the beginning of Meiosis. This is PROPHASE 1. This is the process when the membrane dissolves and the chromosomes are starting to move towards each other.


Thursday, November 20, 2014
Osmosis Demonstration-Jenny
(I apologize for the bad quality, but the two foods are in fact expanding).
Monday, November 10, 2014
Saturday, November 1, 2014
Enzyme Lab Report- Jacob
Introduction:
Enzymes are biological molecules that act as a catalyst with three characteristics. Enzyme increase the rate of reactions. Enzymes act with reactant called a substrate to produce a product.
Purpose:
This is an experiment where we test the enzymes and how they are impacted by temperature changes.
HYPOTHESIS:
"If the temperature of water affects the production rate of enzymes,
then once the temperature of the water/substance has reached around room
temperature, the production rate will start to slow down.
then once the temperature of the water/substance has reached around room
temperature, the production rate will start to slow down.
Independent Variable:
Temperature (Celsius)
Dependent Variable:
the enzyme’s rate of reaction
Controlled Variables:
Volume of the extract
Justification of hypothesis:
Since enzymes work best at normal human body temperature, they could end up declining.
Materials:
-Test tubes -Ruler
-Oak grass -Beakers
-Hydrogen Peroxide -Stopwatch
-Water
-Ice
PROCEDURE:
- Collect and Set up the materials at a lab station with the ice or hot
water baths that are Room temperature (20 degrees Celsius), Cold (0
degrees Celsius), and hot (50 degrees Celsius) - Collect the oak grass and it with a mortar and pestle until it reaches a watery substance
- Tape the ruler onto the test tubes.
- To create
the extract for this experiment, you need to take the 2 mL of the
oak grass substance and mix it with a bit of water into a test tube. - To heat up/cool down the extract, add it to the bath until it has reached the temperature you want it to be at.
- When it is done add ½ mL of the per-oxidase to the test tubes
- Measure
how many bubbles appear once the reaction starts by timing how tall the
bubbles get every 10 seconds (for a total of 60 seconds) and the height
of the bubbles when it has reached its peak. - Repeat the process for remaining test tubes.
- Collect data and analyze results.
Summary:
We started with the materials and slowly made our way to making test tubes
with different liquids. Once they were ready we measured the bubbles
and used the stopwatch to record their size every ten seconds. Our
results were then recorded on a table on a piece of paper. When we
finished testing every single test tube we came up with our final
results.
with different liquids. Once they were ready we measured the bubbles
and used the stopwatch to record their size every ten seconds. Our
results were then recorded on a table on a piece of paper. When we
finished testing every single test tube we came up with our final
results.
DATA AND RESULTS:
Cold- 0 degrees Celsius
Time: Height:
0 sec 0 mm
10 sec 2 mm
20 sec 4 mm
30 sec 7 mm
40 sec 10 mm
50 sec 12 mm
60 sec 14 mm
Room Temperature- 20 degrees Celsius
Time: Height:
0 sec 0 mm
10 sec 30 mm
20 sec 35 mm
30 sec 40 mm
40 sec 45 mm
50 sec 49 mm
60 sec 50 mm
Hot- 50 degrees Celsius
Time: Height:
0 sec 0 mm
10 sec 19 mm
20 sec 25 mm
30 sec 33 mm
40 sec 40 mm
50 sec 42 mm
60 sec 45 mm
CONCLUSION:
Our hypothesis was wrong, our room temperature measurements increased every ten seconds. we thought it was going to change
Enzyme Lab Report- Sayra
Hypothesis:
If the temperature of water affects the production rate of enzymes, then once the temperature of the water/substance has reached around room temperature ,the production rate will start to slow down.
Independent Variable:
Temperature (Celsius)
Dependent Variable:
the enzyme’s rate of reaction
Controlled Variables:
Volume of the extract
Justification of hypothesis:
Since enzymes work best at normal human body temperature, they could end up declining.
Materials:
-Testtubes -Ruler
-Oakgrass -Beakers
-Hydrogen Peroxide -Stopwatch
-Water
-Ice
Procedure:
- 1) Collect and Set up the materials at a lab station with the ice or hot water baths that are Room temperature (20 degrees Celsius), Cold (0 degrees Celsius), and hot (50 degrees celsius)
- Collect the oakgrass and it with a mortar and pestle until it reaches a watery substance
- Tape the ruler onto the test tubes.
- To create the extract for this experiment, you need to take the 2 mL of the oakgrass substance and mix it with a bit of water into a test tube.
- To heat up/cool down the extract, add it to the bath until it has reached the temperature you want it to be at.
- When it is done add ½ mL of the peroxidase to the test tubes
- Measure how many bubbles appear once the reaction starts by timing how tall the bubbles get every 10 seconds (for a total of 60 seconds) and the height of the bubbles when it has reached its peak.
- Repeat the process for remaining test tubes.
- Collect data and analyze results.
Summary:
We started with the materials and slowly made our way to making test tubes with different liquids. Once they were ready we measured the bubbles and used the stopwatch to record their size every ten seconds. Our results were then recorded on a table on a piece of paper. When we finished testing every single test tube we came up with our final results.
Data and Results:
Cold- 0 degrees Celsius
Time: Height:
0 sec 0 mm
10 sec 2 mm
20 sec 4 mm
30 sec 7mm
40 sec 10mm
50 sec 12mm
60 sec 14mm
Room Temperature- 20 degrees Celsius
Time: Height:
0 sec 0 mm
10 sec 30 mm
20 sec 35mm
30 sec 40mm
40 sec 45mm
50 sec 49mm
60 sec 50mm
Hot- 50 degrees Celsius
Time: Height:
0 sec 0mm
10 sec 19mm
20 sec 25mm
30 sec 33mm
40 sec 40mm
50 sec 42mm
60 sec 45 mm
Conclusion:
Our hypothesis was wrong, our room temperature measurements increased every ten seconds.
Enzyme Lab Report- Jenny
Introduction:
It is said that enzymes work best at normal room temperature, so our group decided to test this. After much research, we discovered that the enzymes work best under normal room temperature, which is around 20 degrees Celsius.
Hypothesis:
It is said that enzymes work best at normal room temperature, so our group decided to test this. After much research, we discovered that the enzymes work best under normal room temperature, which is around 20 degrees Celsius.
Hypothesis:
If the temperature of water affects the production rate of enzymes, then once the temperature of the water/substance has reached around normal air temperature (20 degrees Celsius), the production rate will start to decline.
Independent Variable:
Temperature in Celsius
Dependent Variable:
Rate of reaction
Controlled Variable:
The protein source and (hydrogen peroxide) and the type of water
Justification of Hypothesis:
I wanted to know at what point the productivity of the enzymes starts to decline, and enzymes work best at normal human body temperature which could mean that this could be the point where it starts to decline.
Materials:
digital scale one handful of freshly picked bindweed vines with leaves (5-10 grams)mortar and pestle distilled water 3 one hundred liter beakers 2 ml. syringe hydrogen peroxide paper towel 8 glass test tubes, test tube rack, small plastic ruler, safety goggles ice 3 large plastic beaker (ice bath, hot water, body temperature water) hot water thermometersProcedure:
We are going to test the effects that temperature has on the production rate of enzymes. We are going to have 3 different beakers filled with 20, 50, 40, and 3 degrees Celsius. We are going to test the rate of reaction in these three temperatures.
Steps:
- Collect and Set up the materials at a lab station with the ice/hot water baths (20, 50, 40, and 3 degrees Celsius)
- Collect the bindweed leaves and grind them up with a mortar and pestle until it reaches a watery substance
- Tape the ruler onto the test tubes.
- To create the extract for this experiment, you need to take the 35 grams of the bindweed and add it to 55 mL of water.
- Filter the substance through a paper towel and into a beaker. You will then have 60 mL extract that looks like green water.
- Add 2 mL of the extract into each test tube. (you don’t need a lot of the extract in each tube, but you make enough just in case.
- To heat up/cool down the extract, add it to the bath until it has reached the temperature you want it to be at.
- Add the bindweed to the test tube.
- Add 3 mL peroxidase to the four test tubes.
- Measure how many bubbles appear once the reaction starts by timing how tall the bubbles get every 5 seconds (for a total of 30 seconds) and the height of the bubbles when it has reached its peak.
- Repeat the process for remaining test tubes.
- Collect data and analyze results.
Data and Results:
(This section should include at least one graph!) *
Time in seconds Height in centimeters
Control (20 degrees Celsius)- Time: Height
0: 6.1
5: 6.1
10: 6.2
15: 6.3
20: 6.6
25: 6.8
30: 6.8
Temperature #1- hot (50 degrees Celsius)- Time: Height
0: 6.1
5: 6.1
10: 6.2
15: 6.2
20: 6.3
25: 6.3
30: 6.4
Temperature #2- medium (40 degrees Celsius)- Time: Height
0:6.1
5: 6.1
10: 6.2
15:6.4
20:6.5
25: 6.5
30: 6.5
Temperature #4- Cold (3 degrees Celsius) Time: Height
0:6.1
5: 6.1
10: 6.1
15: 6.1
20: 6.1
25: 6.2
30: 6.2
*I couldn't figure out how to make a graph on this, but I am going to keep trying to get one.
*I couldn't figure out how to make a graph on this, but I am going to keep trying to get one.
Conclusions:
Our hypothesis was confirmed as true, because after the temperature reached normal body temperature, the production rate started to decline.
Subscribe to:
Posts (Atom)